Senior Undergraduate Thesis Project: Moral Licensing at Different Stages of Choice: An Eye-Tracking Study

Thank you for your interest in my senior thesis project! This was a culmination of more than two years of research and data analysis and was also a component of my Graduation with Distinction process at Duke!

This research has been presented at many poster sessions, including the 2025 Social & Affective Neuroscience Society in Chicago, IL.

Please note: these figures are **not** comprehensive. This study has not been published and is currently ongoing, so all figures and methods are not public. If you would like to view the results (and/or see a detailed methods section) as part of my portfolio, please email me.

Regression: Percent Chosen vs. Mean Gaze

PercentChosen = β0 + β1 × DwellMean

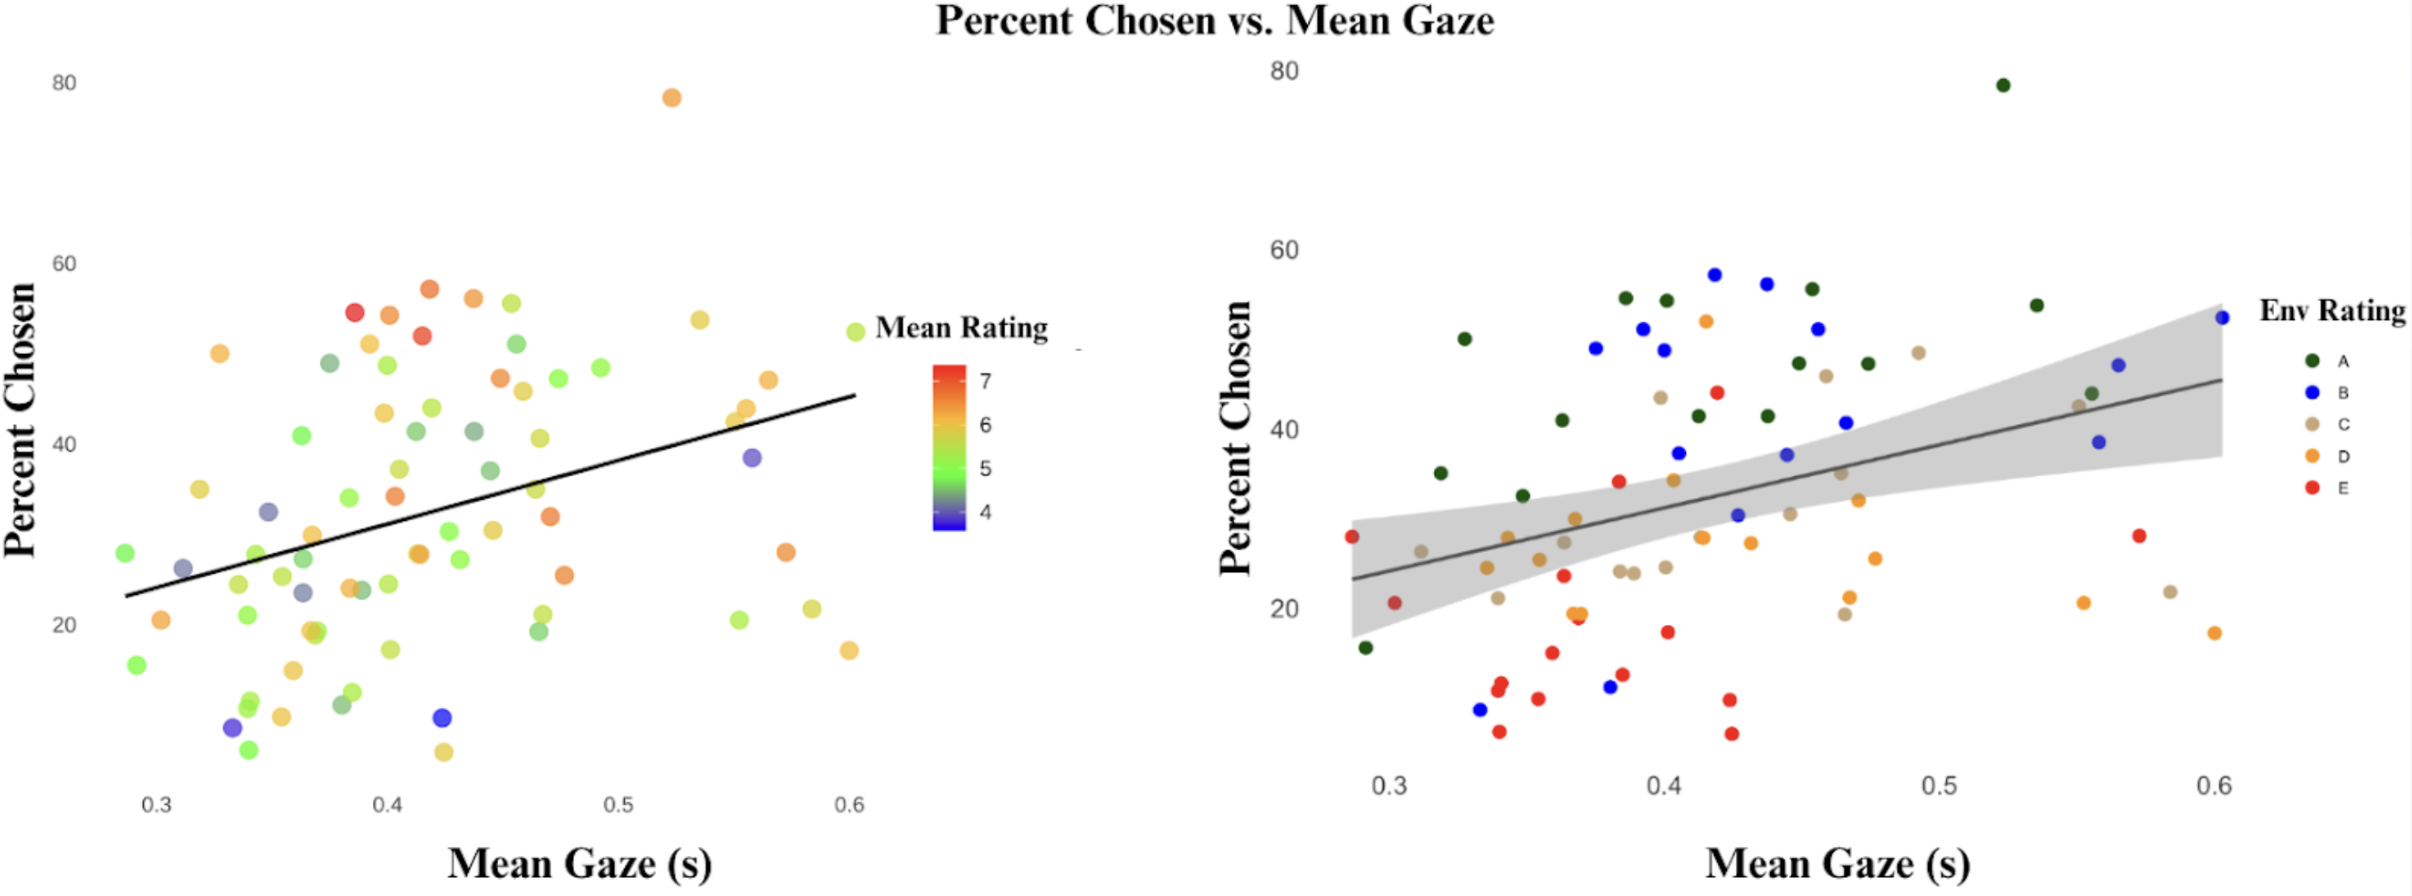
Percent of time an item was chosen (based on how many times it was shown) as a function of mean gaze (s) for each item. The modeled linear relationship (given by the above regression) is significant (p < 0.01).

Regression: Percent Chosen vs. Mean Gaze

These figures demonstrate the results from the two-stage choice paradigm. Specifically, Graph A is the predictive gaze on the antisocial option based on the presence/absence of the prosocial option. Graphs B & C demonstrate the predictive probability of choosing an antisocial option and gaze on prosocial option based on the Two-Stage condition, respectively. Graph D represents the predictive gaze on the antisocial option in the final step, given that a prosocial option was included in the menu.

Regression: Percent Chosen vs. Mean Gaze

As shown in the figure, all trial types were above the chance threshold for choosing the most looked at option within that specific trial type (dashed line).

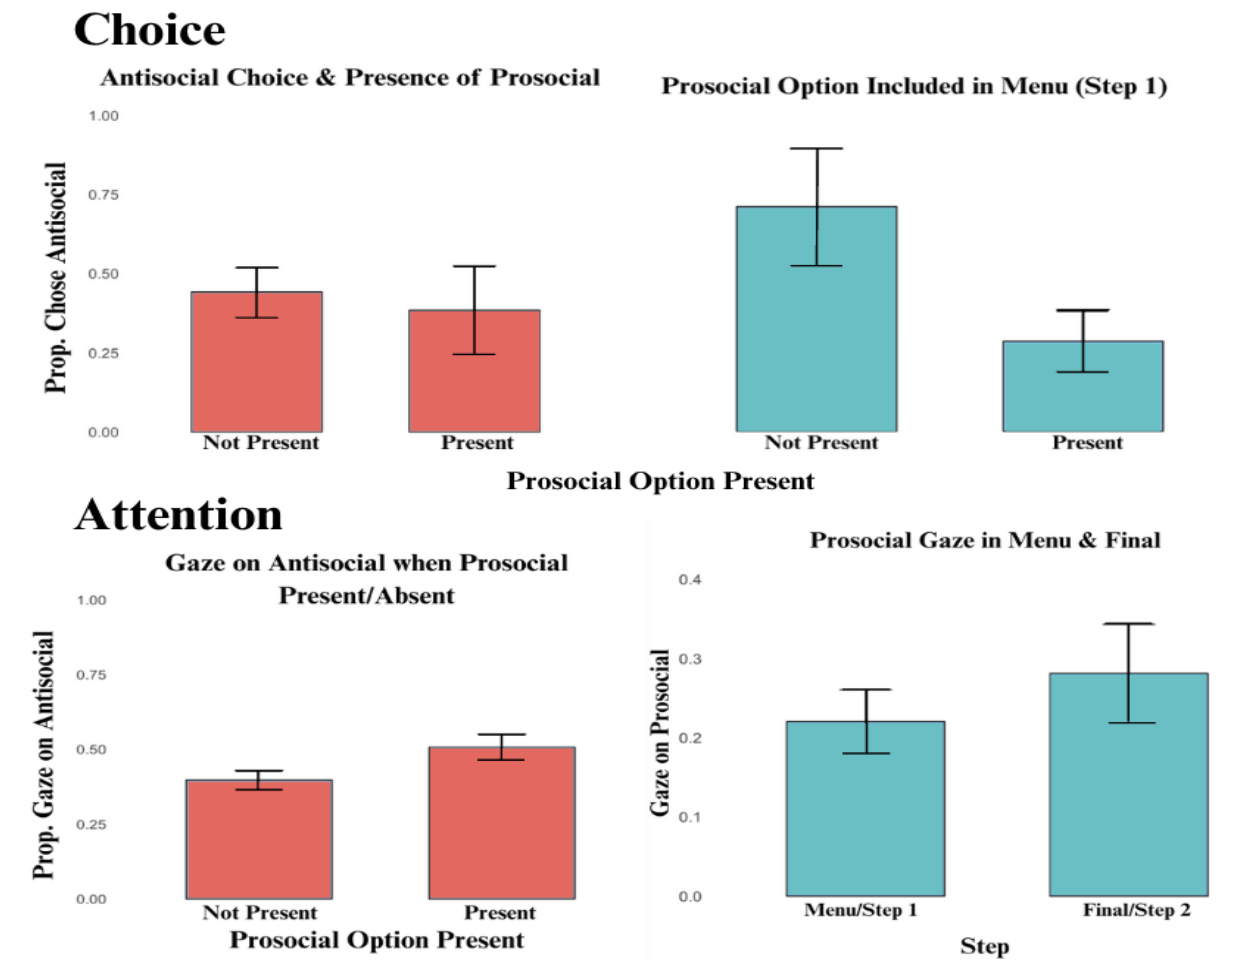
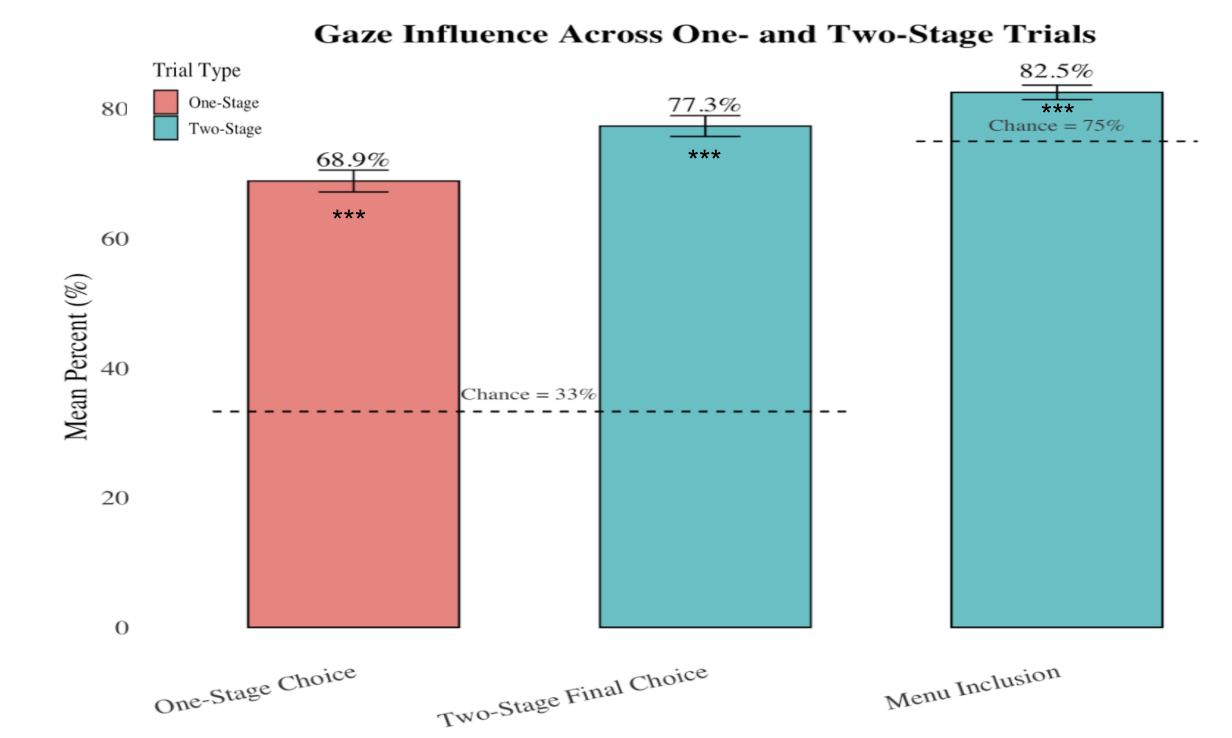
These were only a few exploratory analysis we looked at in regards to eye tracking. As mentioned, several other analyses were included in my final senior thesis. To see these analyses, please email me.